Level: Intermediate Performance Analyzer is a Java-based graphical tool that you can use to analyze the performance of WebSphere Process Server V6.1. This article introduces Performance Analyzer and shows you how to use the simple Java-based tool to check memory stability and predict server crashes.
Garbage collection is the virtual machine (VM) process of deallocating unused Java™ objects in the Java heap. The Java heap is where the objects of a Java program live. It is a repository for live objects, dead objects, and free memory. When an object can no longer be reached from any pointer in the running program, the object is garbage. The Java virtual machine (JVM) heap size determines how often and how long the VM spends collecting garbage. An acceptable rate for garbage collection is application-specific and you should adjust it after analyzing the actual time and frequency of garbage collections. If you set a large heap size, full garbage collection is slower, but it occurs less frequently. If you set your heap size in accordance with your memory needs, full garbage collection is faster, but occurs more frequently. The goal of tuning your heap size is to minimize the time that you spend doing garbage collection while maximizing the number of clients that you can handle at a given time. You might see the following Java error if you are running out of heap space:
java.lang.OutOfMemoryError <<no stack trace available>> java.lang.OutOfMemoryError <<no stack trace available>> |
|
IBM® WebSphere® Process Server V6.1 Performance Analyzer is a Java-based tool that dynamically shows the heap usage (used and free heap) for WebSphere Process Server V6.1. You can use Performance Analyzer to: - Determine if the memory usage is stable.
- Predict if JVM is going to run out of memory and crash eventually.
The Performance graph is a visual aid that shows you how the JVM is performing based on the load in the system. The graph updates itself dynamically. The lines in the graph are color coded to differentiate between current JVM heap size, heap in use, and free heap. The color codes are described as follows in Table 1:
Color code | Description |
RED | Shows the current JVM heap size. The maximum value specified in WebSphere Process Server for this sample run is 1.5GB, as seen on the y axis. |
GREEN | Shows the heap in use. The fact that you see this line continuously increasing towards the red line shows that there is a memory leak and eventually performance degradation. |
BLUE | Shows the free heap. If your WebSphere Process Server does have performance issues, you will see this line decreasing continuously. |
‘X’ | Shows the allocation failures at various GC cycles. |
A stable JVM is one in which the heap size becomes constant after a certain period of time, see Figure 1. An unstable JVM is one in which in which the heap size continuously increases over many GC cycles, see Figure 2.
Performance Analyzer provides these benefits: - Performance Analyzer helps you predict if the JVM is going to run out of memory and crash eventually.
- Performance Analyzer does not require that you have a great deal of knowledge about the JVM heap.
- The performance graph provides you with just enough data/visual content to easily prove/report a performance issue.
- Performance Analyzer is Java based, hence it runs on any platform.
- The Performance Analyzer graph updates itself dynamically.
- Performance Analyzer provides a report of the heap analysis.
- Performance Analyzer also has a command line interface.
Performance Analyzer feeds off the data in the Verbose GC logs; however, the default settings in WebSphere Process Server do not create Verbose GC logs. Performance Analyzer needs to be turned on manually. Use the following steps to turn it on. - Login to the WebSphere Process Server admin console.
- Go to Application servers => server name => Process Execution => Process Definition => Java Virtual Machine.
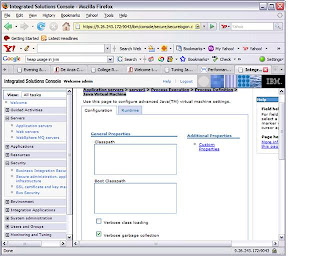
- Enable the Verbose Garbage collection check box, see Figure 3.
Figure 3. Enabling Verbose GC
In addition to turning on Verbose GC collection, you might want to tune your JVM for optimum performance. Although many articles are available on the Web for JVM tuning, use the steps below for this article: - From the WebSphere Process Server admin console, select Servers => Application Servers.
- Click server name.
- Under server infrastructure expand “Java and Process Management” by clicking on the “+” icon.
- Select link Process definition.
- Select Process definition => Additional properties => Java Virtual Machine.
- Increase max heap size to 1024 and above depending on configuration.
- Paging (that is, page faults) can cause severe performance problems for your application and result in long garbage collection pauses. To avoid paging, ensure that -Xmx is not set to more than 75 percent of the physical memory of the system.
- Fragmentation refers to the existence of free chunks of memory in the heap that are too small for object allocation.
The following recommendations will help you avoid fragmentation: - The easiest way to avoid fragmentation is to increase the heap size within its natural limits.
Option | Use |
-XXcompactratio:nn | Sets the percentage (nn) of the heap that should be compacted at each old collection. |
-XXfullcompaction | Compacts the entire heap at each old collection. |
- Normally, a partial compaction of each old collection occurs with the garbage collection. If you think this default compaction ratio is either insufficient or "overkill," you can turn it down; thus reducing pause times, by using some combination of the compaction start-up options listed here.
- Use a generational garbage collector. During a young collection (nursery garbage collection) the objects that are found live in the nursery are moved to the old generation. This has the positive side-effect of compacting the objects while they are moved.
- For Generic JVM arguments:
Set “-Dibm.dg.trc.print=st_verify -Xgcpolicy:optavgpause -Xcompactgc –Xnopartialcompactgc”
- For Generic JVM arguments:
Set Initial heap size 512
Set maximum heap size 1536
- A very useful guide for doing tune up parameters for JVM can be found at:
WebSphere z/OS Information Center: Tuning Java virtual machines
To run Performance Analyzer: - Enable Verbose GC via WebSphere Process Server Admin Console (with or without tuning parameters - jvm arguments).
- Perform the WebSphere Process Server activities that you suspect would cause performance degradation (for example, install/uninstall applications, run your scenario for a certain time period, and so forth). After performing step 2, you will see a native_stderr.log generated in your logs directory.
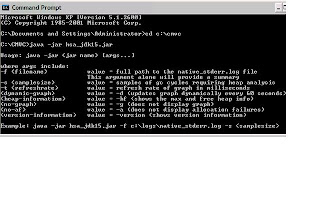
- Download the Performance Analyzer toolkit (see the Download section), and run it against the native_stderr.log as follows to find the valid arguments (see Figure 4).
Figure 4. Command line arguments
- Run the provided toolkit against the native_stderr.log as follows to get a summary and the total GC cycles used, see Figure 5 (This will also show a graph).
Figure 5. Summary of GC cycles used
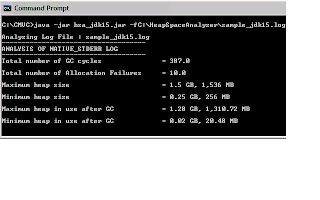
Figure 6. Performance Graph showing an unstable JVM that will eventually run out of memory

For an explanation of color codes and legends in the Graph, see Table 1. - Use the ‘-g’ option if you do not want the graph display.
Example: java -jar hsa_jdk15.jar –f C:\HeapSpaceAnalyzer\sample_jdk15.log -g
- Use the ‘-a’ option if you do not want the graph to display the allocation failures.
Example: java -jar hsa_jdk15.jar –f c:\logs\native_stderr.log -g –a
- With the ‘-d’ option the graph dynamically updates every 60 seconds (default refresh rate).
Example: java -jar hsa_jdk15.jar –f c:\logs\native_stderr.log –d
- Use the ‘-t’ option to change the refresh rate(milliseconds) at which the graph dynamically updates.
Example: java -jar hsa_jdk15.jar –f c:\logs\native_stderr.log –d –t 30000
Hopefully, the ease of use of Performance Analyzer and the dynamic nature of the Performance graph and the platform independence provided by Java will help testers, support teams, and consultants with a very useful tool to keep an eye on the performance of WebSphere Process Server V6.1 on any platform. | 


No comments:
Post a Comment